Understanding of Elasticsearch external service and evolution of usage in the PEGA application
Understanding of Elasticsearch external service and evolution of usage in the PEGA application
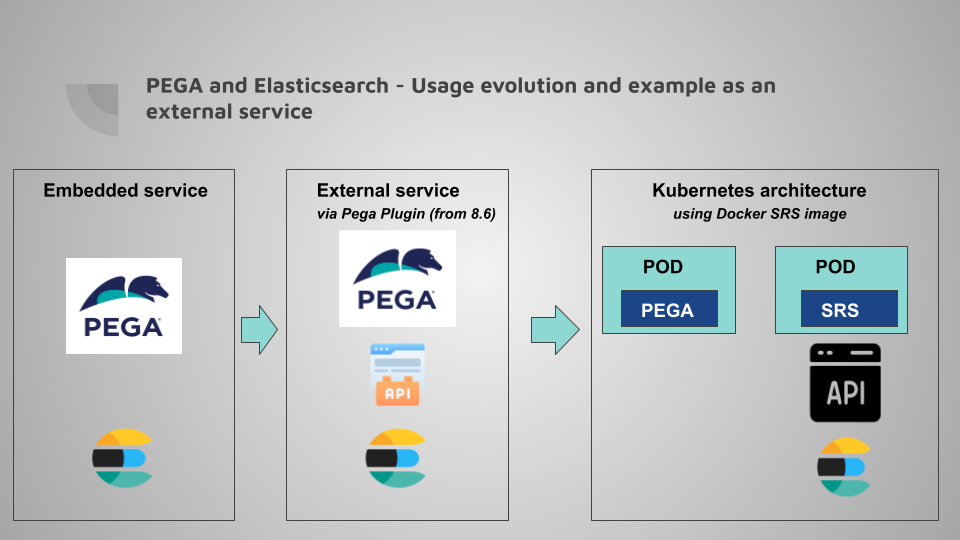
In this post, let’s understand the Elasticsearch service and the evolution of usage in the Pega versions. Elasticsearch is a robust, scalable, and distributed text-based search engine. It is used for Real-time search, Full-text search, Log analytics and monitoring applications. Many organisations maintain their elastic search as a stand-alone central hub app. Other applications like [Front-end web apps, Salesforce, AWS API Gateway APIs, etc…] can leverage the external elastic search service for indexing or search-related requirements. So, understanding how elastic search works is really important. Organisations can leverage the external service from cloud [AWS, Google, Azure, etc…] service providers, stand-alone apps in VM or can run in containers using docker images.
Conventional PEGA product has the elastic search product as an embedded service. Then from PEGA 8.6 onwards provided the capability to connect to an external elastic search service using the provided plugin. From PEGA 8.8 onwards, with Kubernetes deployment recommendation - PEGA provided a separate docker image — Search Reporting Service to connect to an external elastic search. Elasticsearch reduces the database queries in the case of global search and reporting scenarios. Kibana is used as a data analytics and visualization tool.
In PEGA, the system maintains an index file in the stream nodes. Pega provides a custom search properties rule form for customization and also to achieve search on complex embedded page property hierarchies. FTSIncremental Indexer queue processor handles the elastic search.
In this example — let’s simply explore how Elasticsearch works as a stand-alone app and the usage of Kibana for data visualization.
Note: I am running the Elastic search and Kibana apps as docker containers. I am using the docker engine in the Mac.
Prerequisite:
- A basic understanding of how docker containerization works
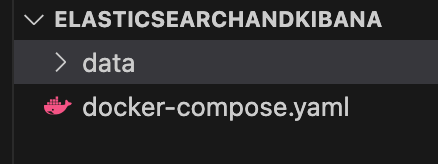
Step 1: Prepare the docker-compose file
- Elasticsearch and Kibana apps are provided as the docker hub images
Prepare the docker-compose file in a folder as below
version: '3.0'
services:
elasticsearch:
container_name: es-container
image: docker.elastic.co/elasticsearch/elasticsearch:7.11.0
environment:
- xpack.security.enabled=false
- "discovery.type=single-node"
networks:
- es-net
ports:
- 9200:9200
volumes:
- $PWD/data:/usr/share/elasticsearch/data
kibana:
container_name: kb-container
image: docker.elastic.co/kibana/kibana:7.11.0
environment:
- ELASTICSEARCH_HOSTS=http://es-container:9200
networks:
- es-net
depends_on:
- elasticsearch
ports:
- 5601:5601
networks:
es-net:
driver: bridge
Here we are generating two services — elasticsearch and kibana. Elasticsearch service persists the data as configured under volumes.
Step 2: Execute the docker-compose
- Open the terminal
- Execute the docker-compose file to spin the containers using the below command
docker-compose up -d
Open the docker app to see the containers running status

Note: Verify as specified in the file, Elasticsearch is running on the port 9200 and Kibana is running on the port 5601.
Step 3: Test the Elasticsearch and Kibana services
- Open the Kibana service port URL
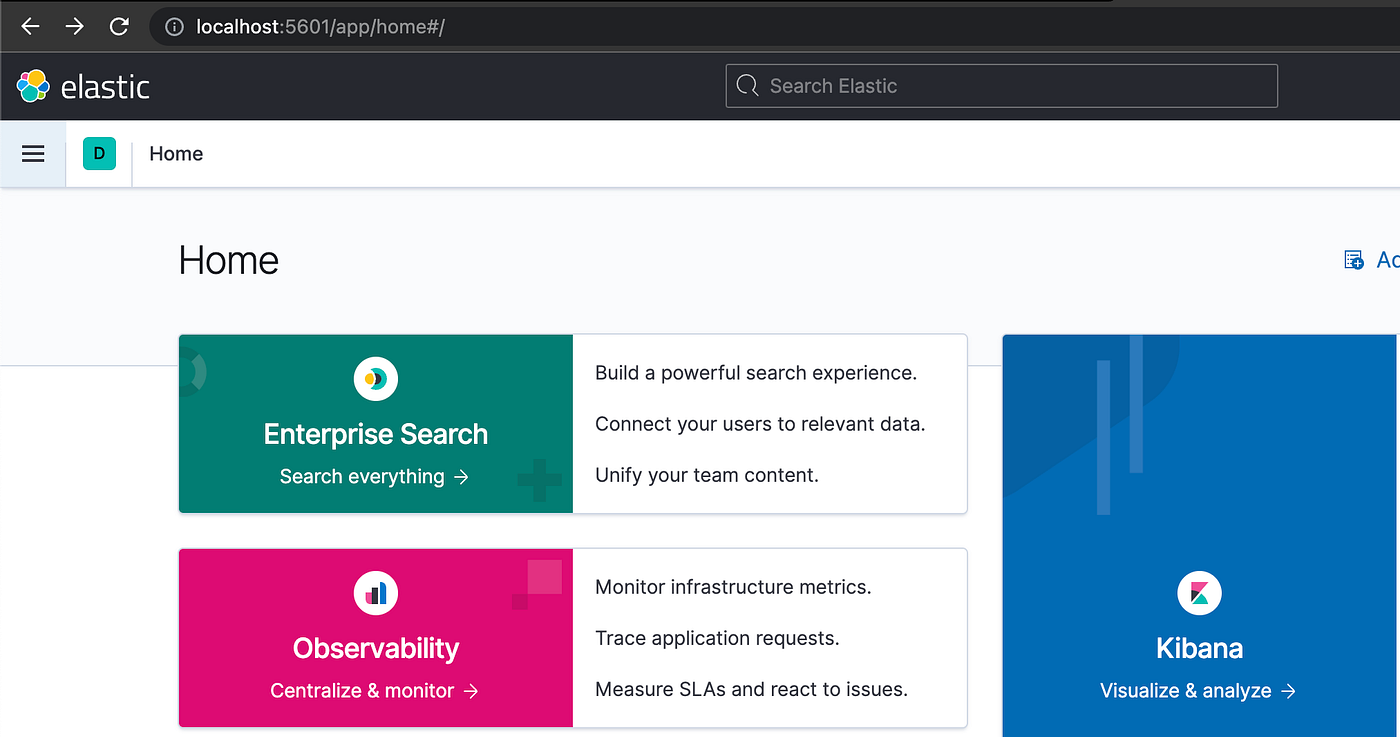
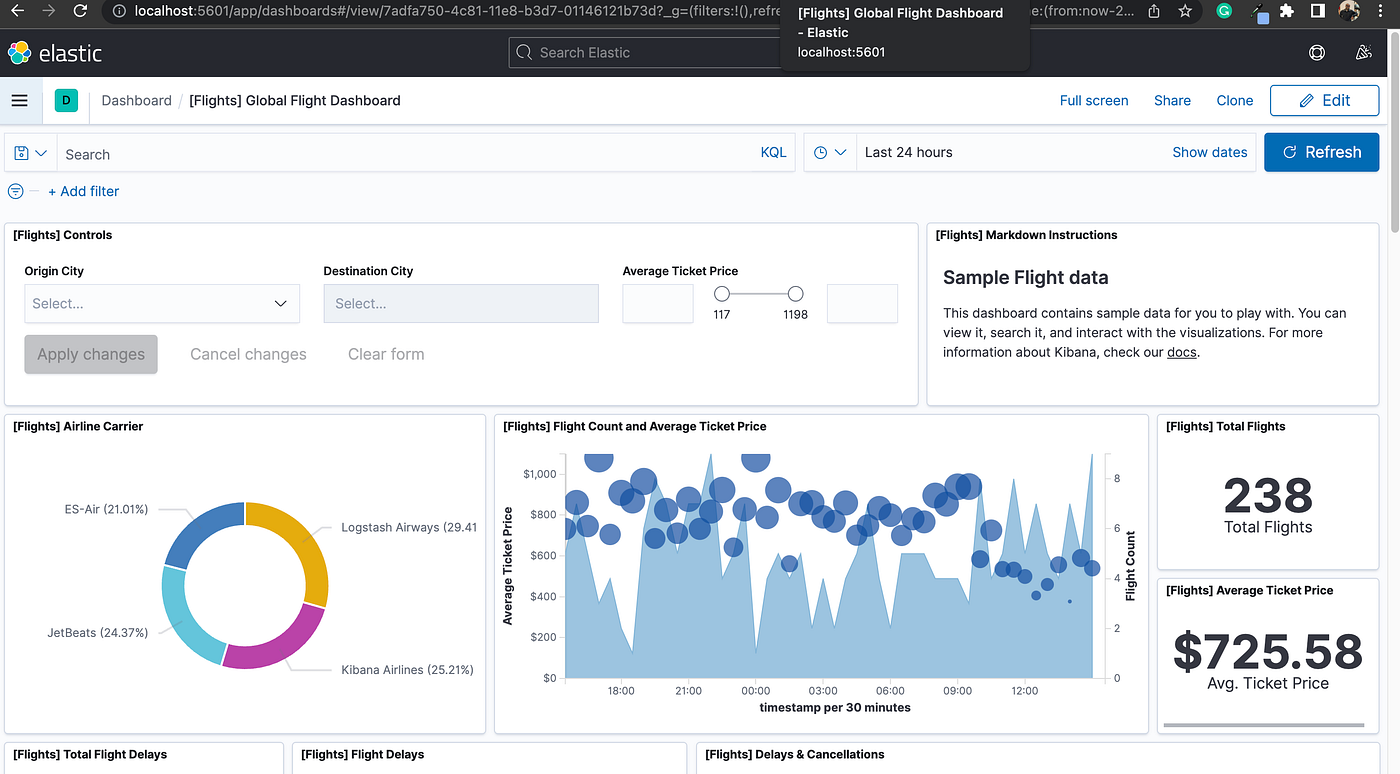
- Add the sample data for testing purposes. In this scenario, I selected the “Sample flight data” one.
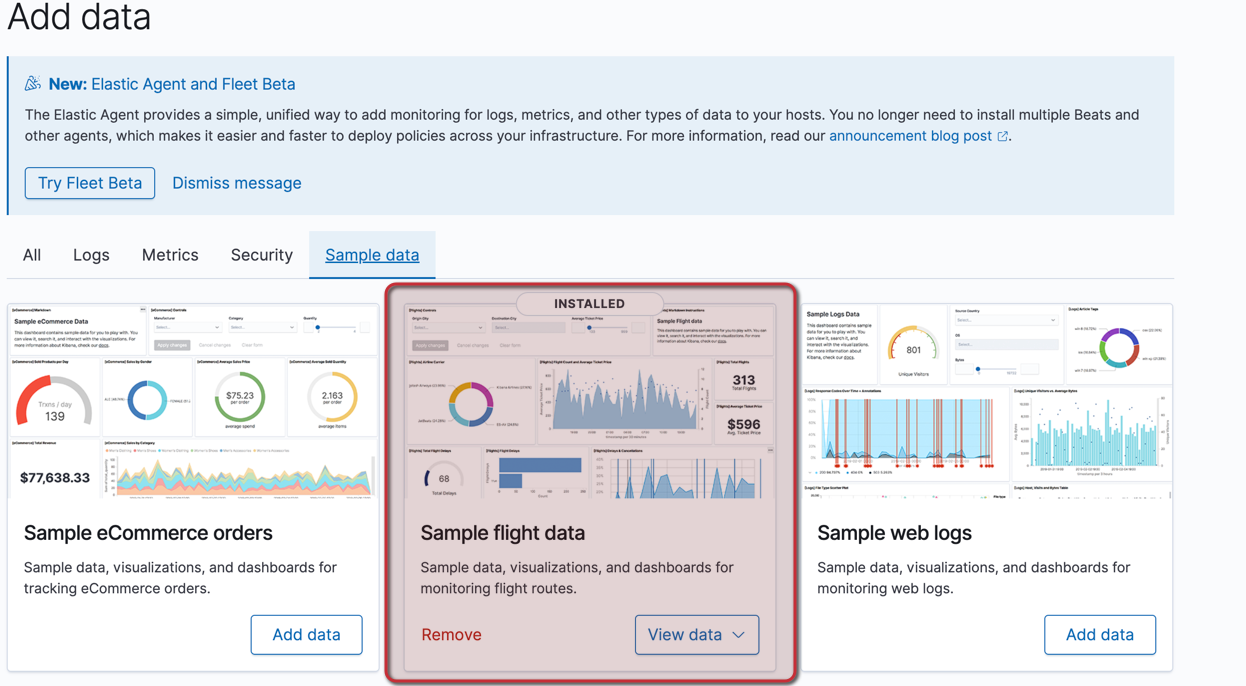
- Verify the dashboard for the data visualization
Step 4: Use postman to perform Elasticsearch CRUD operations
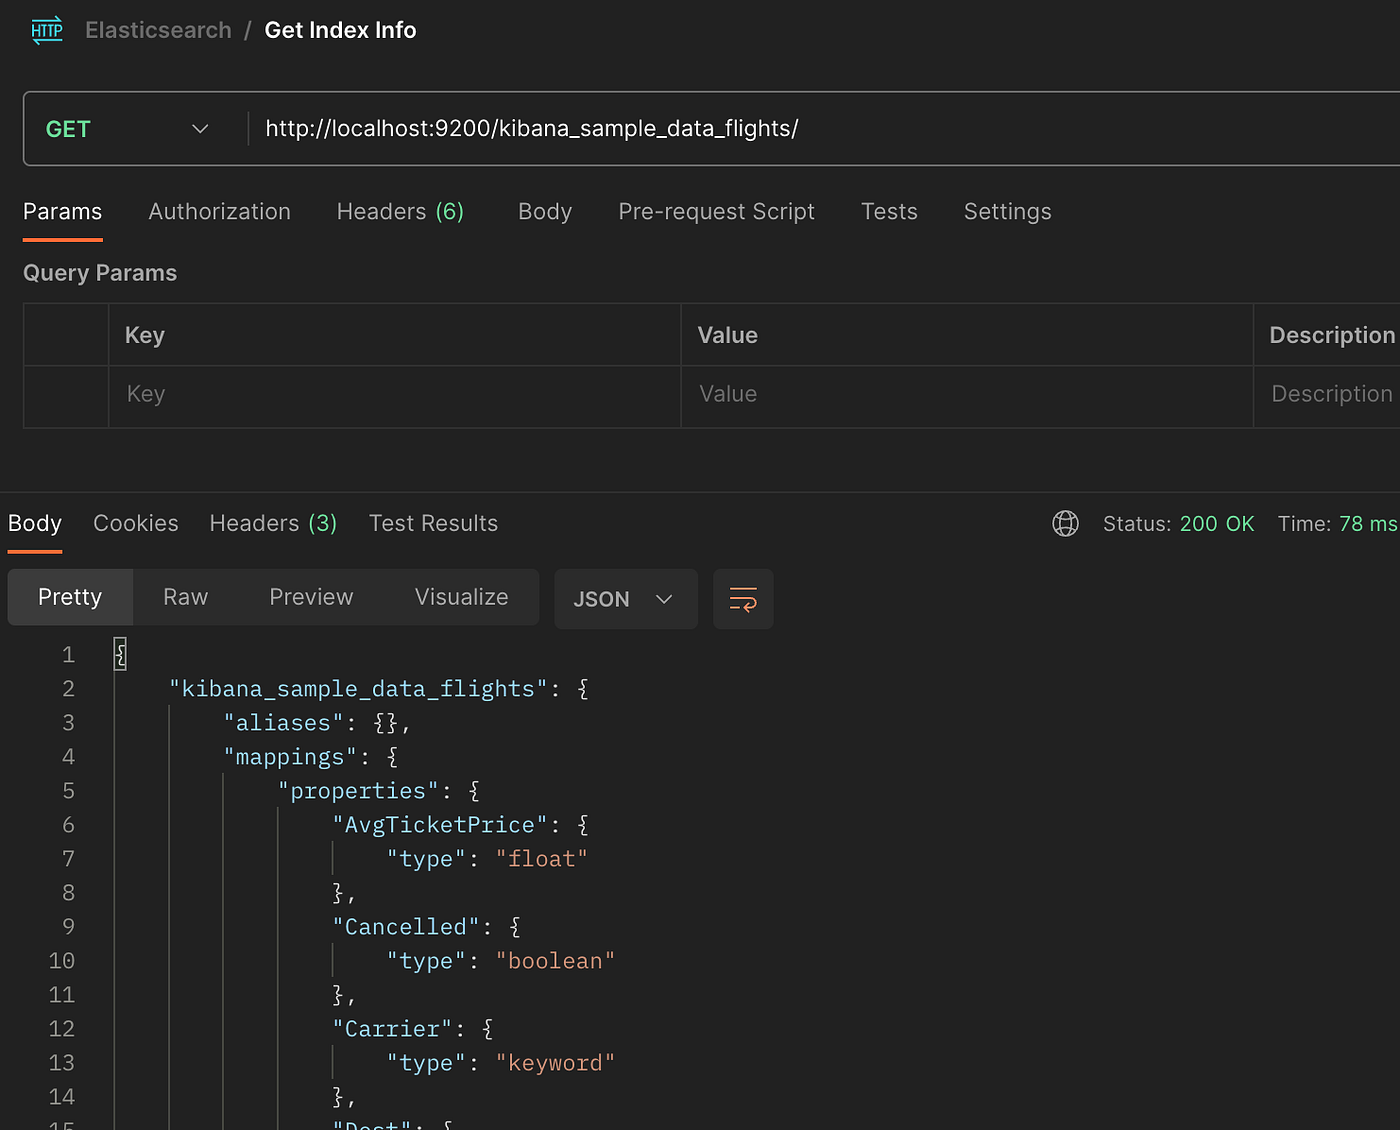
GET — Index Info
http://localhost:9200/kibana_sample_data_flights/
Get the elasticsearch index information as below.
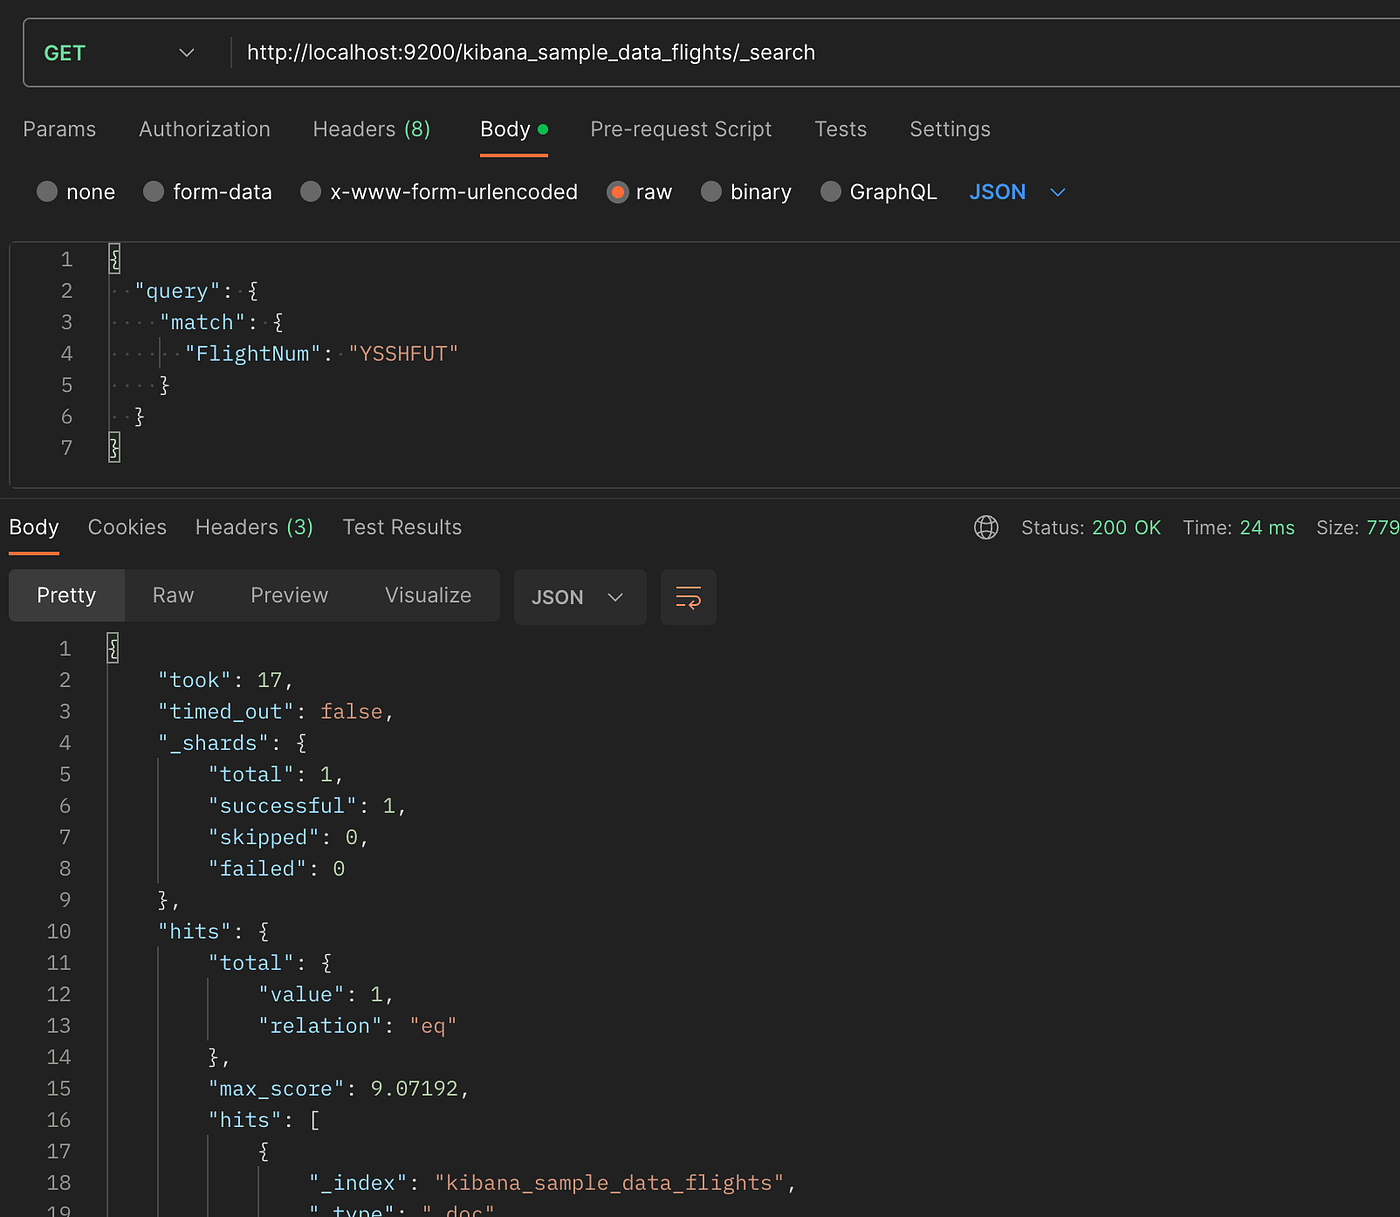
GET — Search Index Info
http://localhost:9200/kibana_sample_data_flights/_search
Perform a search — in this case based on the Flightnumber field.
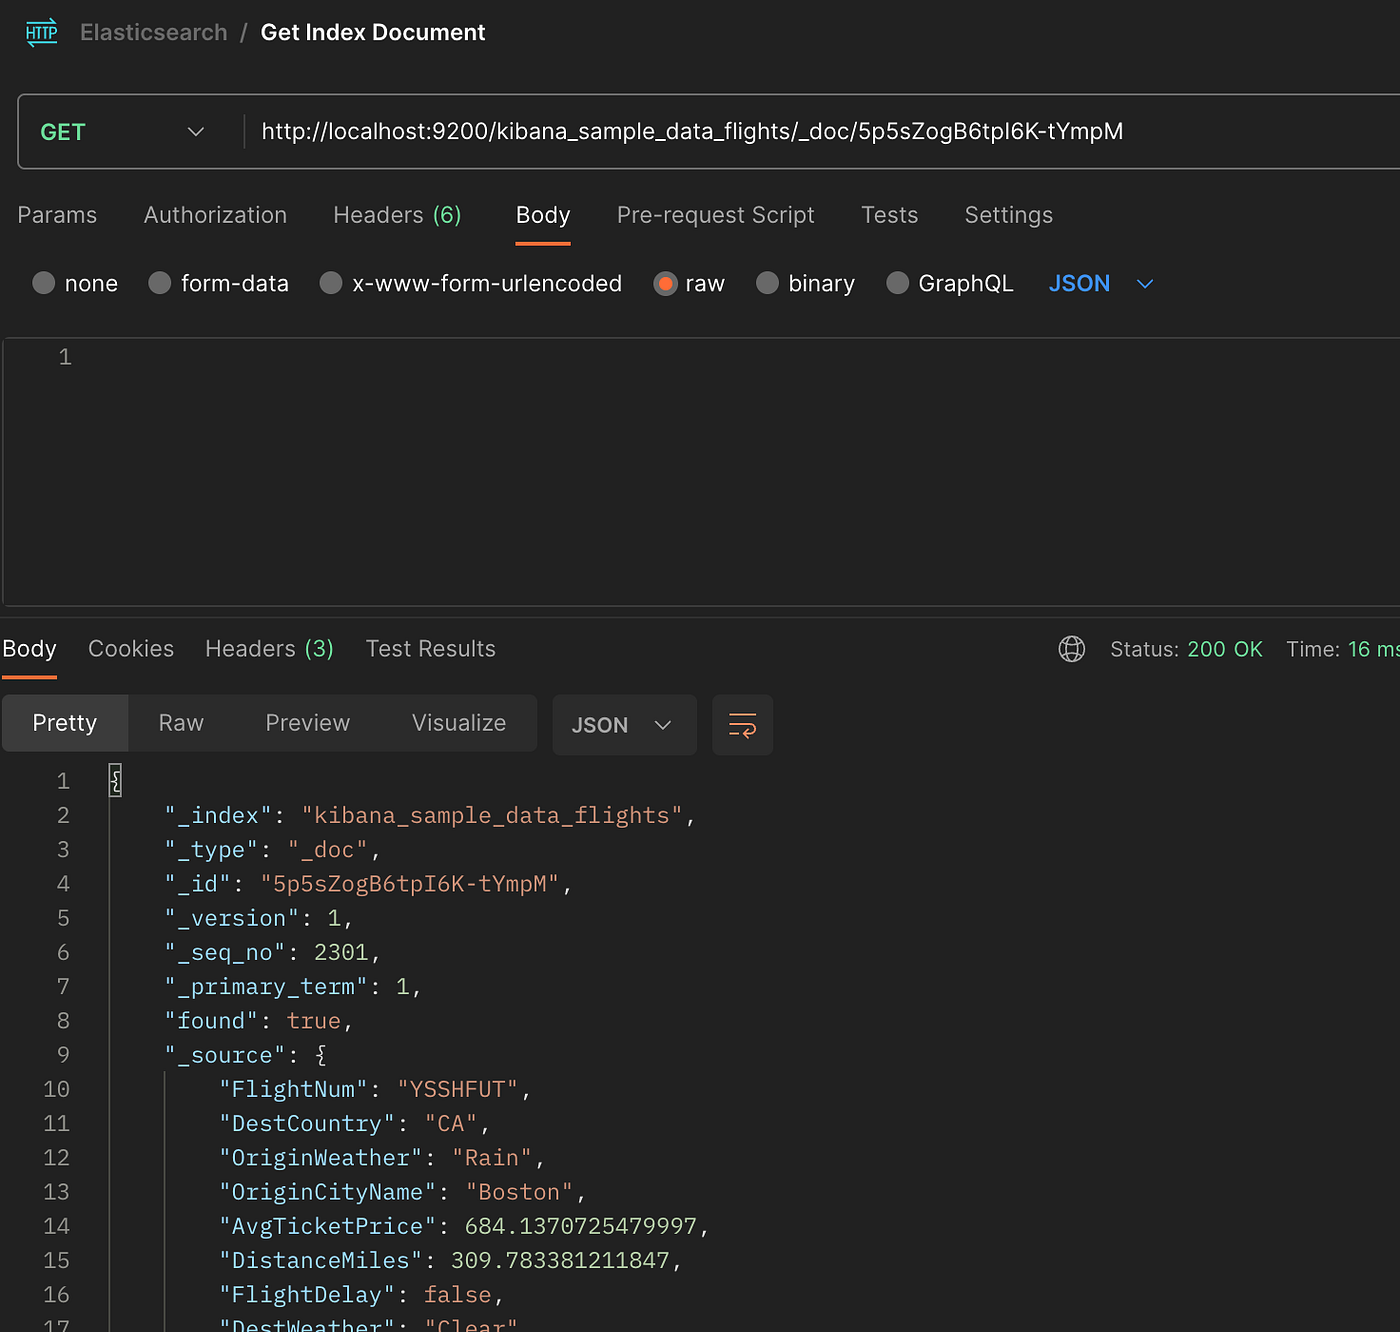
GET — Get Index document
http://localhost:9200/kibana_sample_data_flights/_doc/5p5sZogB6tpI6K-tYmpM
Get the the document information based on the doc id.
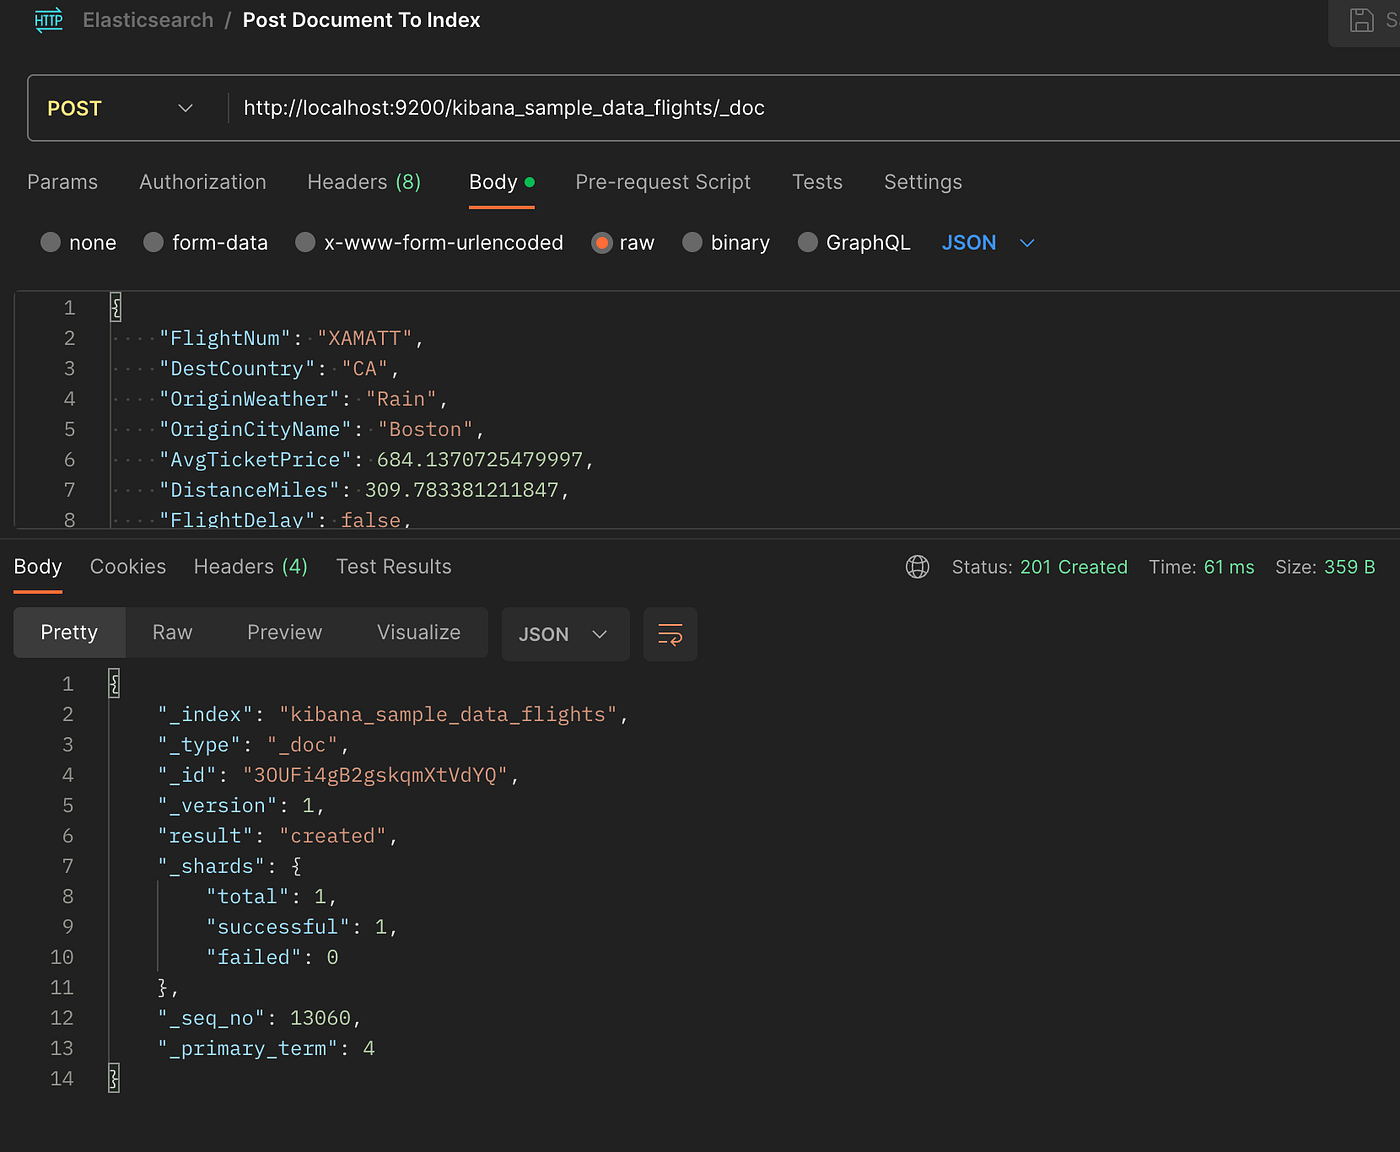
POST — Post a document to the Index
http://localhost:9200/kibana_sample_data_flights/_doc
Post a document to the index.
Hurrayyyyyyyyyy, Congratulations :) Now you successfully understood the elasticsearch usage as a stand-alone application and how usage evolved in the Pega application versions.